
Skilled Trade Salary Statistics 2026: Wages, Openings, and Injury Rates
Key takeaways (copy these)
- The median annual wage for all U.S. occupations was $50,980 in May 2025. BLS OEWS, May 2025. https://www.bls.gov/oes/current/oes_nat.htm
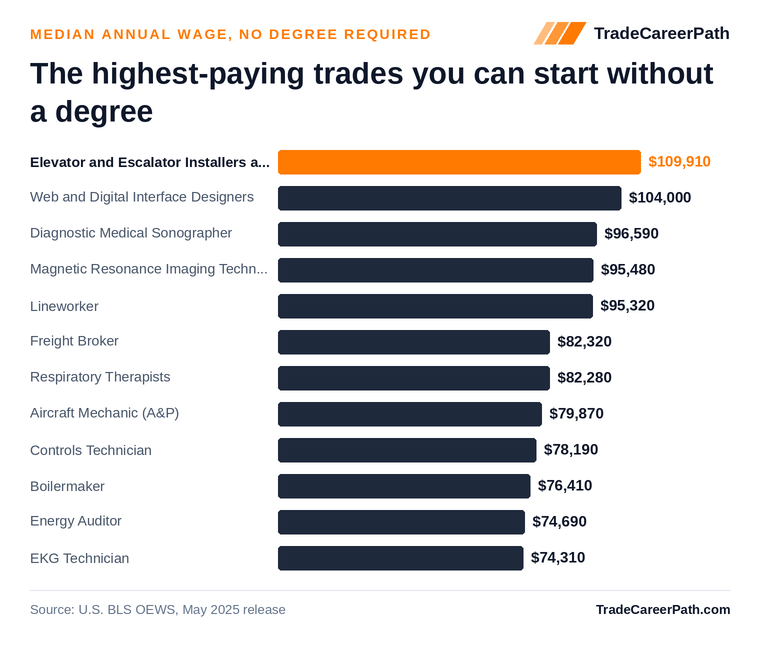
- Elevator and escalator installers and repairers had the highest median among the detailed trades on this page, at $109,910 a year. BLS OEWS, May 2025. https://www.bls.gov/oes/current/oes474021.htm
- Diagnostic medical sonographers had a $96,590 median wage and 13.0% projected employment growth from 2024 to 2034. BLS OEWS, May 2025; BLS EP, 2024-2034. https://www.bls.gov/oes/current/oes292032.htm
- Electrical power-line installers and repairers (lineworkers) had a $95,320 median, 87% above all occupations. BLS OEWS, May 2025. https://www.bls.gov/oes/current/oes499051.htm
- Electricians earned a $63,190 median (24% above all occupations), with 757,220 employed in May 2025. BLS OEWS, May 2025. https://www.bls.gov/oes/current/oes472111.htm
- Electrician pay ran from $42,640 at the 10th percentile to $108,510 at the 90th. BLS OEWS, May 2025. https://www.bls.gov/oes/current/oes472111.htm
- Oregon led states for electrician median pay at $101,310; Kankakee, IL led metros at $105,500. BLS OEWS, May 2025. https://www.bls.gov/oes/current/oes472111.htm
- Plumbers, pipefitters, and steamfitters had a $63,800 median, just above electricians among the three common licensed trades on this page. BLS OEWS, May 2025. https://www.bls.gov/oes/current/oes472152.htm
- HVAC mechanics and installers had a $61,010 median, 8.1% projected growth, and 40,100 openings a year. BLS OEWS, May 2025; BLS EP, 2024-2034. https://www.bls.gov/oes/current/oes499021.htm
- Heavy and tractor-trailer truck drivers accounted for 237,600 projected openings a year, the most of any occupation on this page. BLS Employment Projections, 2024-2034. https://www.bls.gov/emp/tables/occupational-projections-and-characteristics.htm
- BLS projected 81,000 openings a year for electricians and 74,100 for carpenters. BLS Employment Projections, 2024-2034. https://www.bls.gov/emp/tables/occupational-projections-and-characteristics.htm
- Electrician employment is projected to grow 9.5% from 2024 to 2034, versus 3.1% for all occupations. BLS Employment Projections, 2024-2034. https://www.bls.gov/emp/tables/occupational-projections-and-characteristics.htm
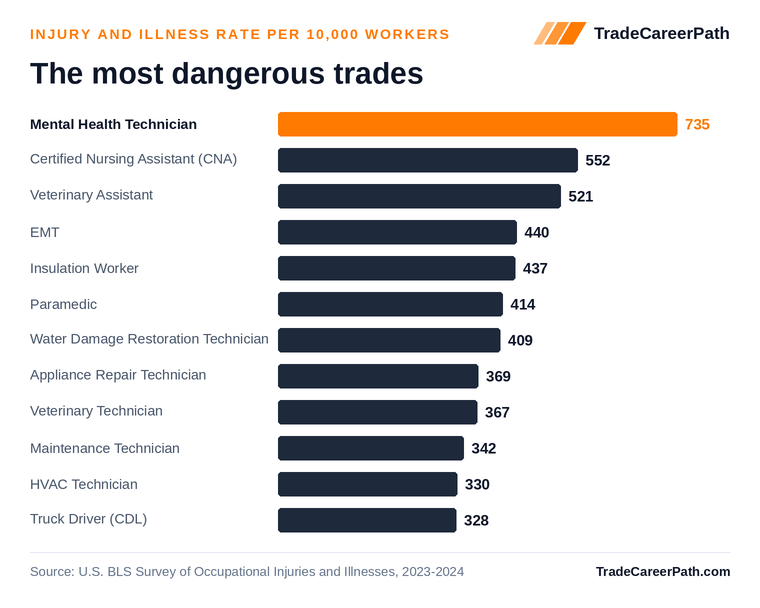
- HVAC technicians had a DART injury rate of 330.3 cases per 10,000 FTE workers, versus 146.9 for electricians and 735.0 for psychiatric technicians. BLS SOII, 2023-2024. https://www.bls.gov/iif/nonfatal-injuries-and-illnesses-tables.htm
These figures are occupation medians for all workers in the SOC, not starting pay and not a promise of what any graduate earns. Outcomes vary by location, experience, overtime, union scale, and the local job market. Compiled by the TradeCareerPath editorial team.
What is the median US wage, and how do trades compare?
The all-occupations median is the baseline on this page. Every premium in the takeaways is that occupation’s OEWS median divided by $50,980, then rounded to the nearest percent. We do not mix the Employment Projections 2024 wage column ($49,500 for all occupations) with the May 2025 OEWS release.
State and metro cuts for the same occupations live on the trade salary data hub.
What is the highest paying trade without a bachelor’s degree?
We limited the “no bachelor’s” set to BLS detailed occupations whose typical entry path is an apprenticeship, certificate, or associate degree, matching the ranking method on highest paying trades 2026. Construction managers and other bachelor’s-typical titles are out of that set even when the wage is higher.
Elevator and escalator installers had the highest median in that set, $109,910. Diagnostic medical sonographers followed at $96,590 and lineworkers at $95,320.
How much do electricians, plumbers, and HVAC technicians make?
Those three are the licensed trades students ask about most on this site. National medians sit in a tight band; the spread inside each occupation is wider than the gap between them.
- Electricians: $63,190. Full cut: electrician salary statistics 2026. City table: electrician salary by metro.
- Plumbers, pipefitters, and steamfitters: $63,800. City table: plumber salary by metro.
- HVAC mechanics and installers: $61,010. Full cut: HVAC technician salary statistics 2026. City table: HVAC salary by metro.
Which metro pays electricians the most?
Metro ranks use OMB metropolitan statistical areas in the May 2025 MSA file. Small metros can lead the dollar ranking with few workers; Kankakee, IL reported 140 electrician jobs. Portland-Vancouver-Hillsboro, OR-WA was next at $105,090 with 7,340 jobs. Use employment alongside the median before treating a metro as a target market. Oregon’s electrician page covers the highest state median ($101,310).
Which trades have the most openings?
Openings are the Employment Projections annual average for 2024-2034. They include growth and replacement. Truck driving dominates the count at 237,600 openings a year. Electrician (81,000) and carpenter (74,100) are the large construction-trade figures on this page.
How fast are these trades growing?
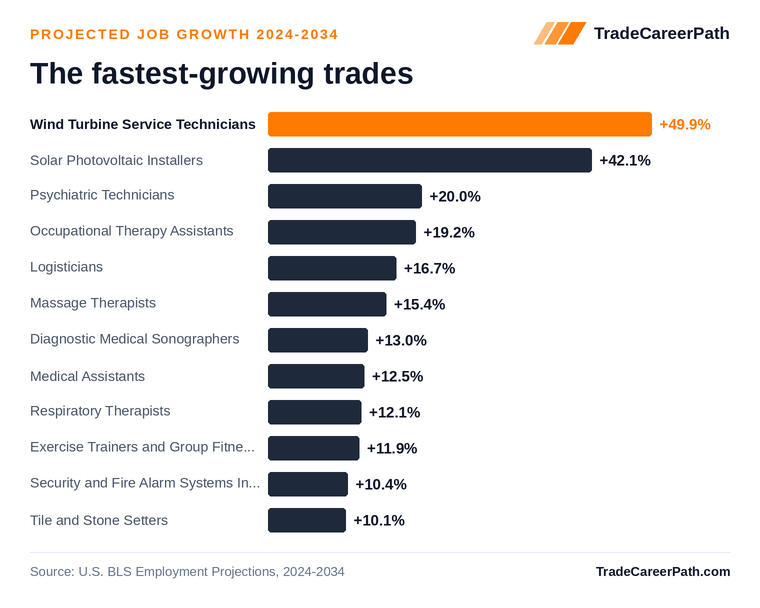
Percent change is also from Employment Projections 2024-2034. The 3.1% all-occupations rate is the comparison line. Sonography is the fastest in this set; HVAC is the fastest of the three common licensed trades.
Which trades have the highest injury rates?
DART is cases per 10,000 full-time-equivalent workers that involved days away, restricted duty, or a job transfer (BLS SOII, 2023-2024). A higher rate means more reported cases per worker, not that any one jobsite is unsafe. HVAC’s rate is more than double electricians’ in the same file. The full ranking is on most dangerous trades.
How to cite these figures
Copy a takeaway line and keep the agency, survey, and date. Example: Electricians, median annual wage $63,190, U.S. Bureau of Labor Statistics, Occupational Employment and Wage Statistics, May 2025, https://www.bls.gov/oes/current/oes472111.htm.
Charts on this page are free to republish with the embed code under each figure. That embed credits TradeCareerPath.com and links back here. Method notes are on data sources.
Wage and injury figures describe the occupation, not a school. They are not starting salaries, placement rates, or guarantees.
Frequently Asked Questions
What is the median US wage compared with skilled trades?
The median annual wage for all U.S. occupations was $50,980 in May 2025 (BLS OEWS). Electricians sat 24% above that at $63,190, and elevator and escalator installers and repairers sat 116% above it at $109,910.
What is the highest paying trade without a bachelor's degree?
Among the detailed occupations on this page, elevator and escalator installers and repairers had the highest May 2025 median, $109,910 a year (BLS OEWS). Diagnostic medical sonographers followed at $96,590 and lineworkers at $95,320.
How much do electricians, plumbers, and HVAC technicians make?
May 2025 national medians were $63,800 for plumbers, pipefitters, and steamfitters; $63,190 for electricians; and $61,010 for HVAC mechanics and installers (BLS OEWS).
Which metro pays electricians the most?
Kankakee, IL had the highest electrician median among metros, $105,500. Oregon led states at $101,310 (BLS OEWS, May 2025).
Which trades have the most job openings?
BLS Employment Projections (2024-2034) put heavy and tractor-trailer truck drivers at 237,600 openings a year, electricians at 81,000, and carpenters at 74,100.
Do trades have higher injury rates than other jobs?
It depends on the occupation. HVAC technicians had a DART rate of 330.3 cases per 10,000 FTE workers, electricians 146.9, and psychiatric technicians 735.0 (BLS SOII, 2023-2024). DART counts cases with days away, restricted duty, or job transfer.
Sources
- U.S. Bureau of Labor Statistics, Occupational Employment and Wage Statistics, May 2025 national and MSA files (
national_M2025_dl.csv,MSA_M2025_dl.xlsx). - U.S. Bureau of Labor Statistics, Employment Projections, 2024-2034 occupational projections and characteristics.
- U.S. Bureau of Labor Statistics, Survey of Occupational Injuries and Illnesses, 2023-2024, table R98.
| Data | Provider | Vintage |
|---|---|---|
| Occupational Employment and Wage Statistics (OEWS) | U.S. Bureau of Labor Statistics | May 2025 |
| Employment Projections | U.S. Bureau of Labor Statistics | 2024-2034 |
| Integrated Postsecondary Education Data System | National Center for Education Statistics (IPEDS) | 2024 |
| College Scorecard (school-level outcomes) | U.S. Department of Education | latest release |
| College Scorecard (field-of-study earnings) | U.S. Department of Education | latest release (updated 2026-06-12) |
| Occupational licensing requirements | CareerOneStop (U.S. Department of Labor) | latest release (updated 2026-02-22) |
| Registered apprenticeship programs | CareerOneStop / Apprenticeship.gov (U.S. Department of Labor) | latest release (updated 2025-10-25) |
| CPI inflation & JOLTS labor turnover | U.S. Bureau of Labor Statistics | latest release (updated 2026-06-14) |
| Fair Market Rents (rent by county/metro) | U.S. Department of Housing & Urban Development | FY2025 (updated 2026-06-14) |
| O*NET occupation profiles (skills, tasks, tools, job zones) | U.S. Department of Labor (O*NET / Employment & Training Admin.) | O*NET 29.1 (updated 2026-06-13) |
About this guide: Researched and written by the TradeCareerPath Editorial Team. Our editorial team researches and sources every trade school and career guide using federal labor and education data, including BLS OEWS and Employment Projections, DOL apprenticeship records, IPEDS, College Scorecard, and state licensing boards. We follow the editorial standards documented at /editorial-policy/.