The Most Dangerous Trades: Injury Rates by Occupation (BLS Data)
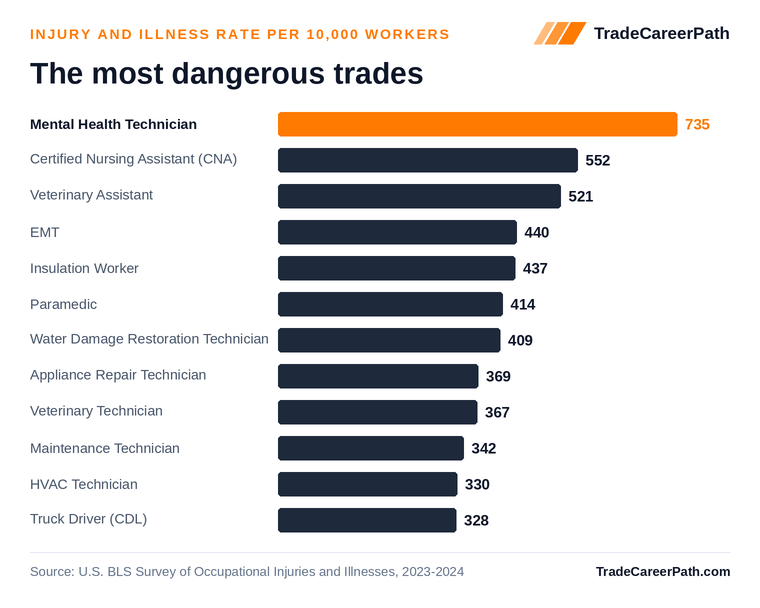
Quick answer: By the days-away/restricted/transfer (DART) injury and illness rate, mental health technician ranks highest among skilled trades at 735 cases per 10,000 workers (U.S. BLS, 2023-2024), followed by certified nursing assistant (cna) and veterinary assistant.
Workplace risk varies widely across the trades. The ranking below uses the U.S. Bureau of Labor Statistics Survey of Occupational Injuries and Illnesses DART rate: cases per 10,000 full-time-equivalent workers that involved days away from work, restricted duty, or a job transfer. A higher rate means more reported injuries and illnesses per worker.
How we ranked these trades
Trades were ranked by the DART (days away, restricted, or transfer) rate per 10,000 full-time-equivalent workers from the U.S. BLS Survey of Occupational Injuries and Illnesses (2023-2024). Rates reflect reported nonfatal cases and vary by employer, setting, and safety program.
The ranking
1. Mental Health Technician
Injury and illness rate of 735 cases per 10,000 full-time workers requiring days away, restricted duty, or job transfer (U.S. BLS Survey of Occupational Injuries and Illnesses, 2023-2024).
2. Certified Nursing Assistant (CNA)
Injury and illness rate of 552 cases per 10,000 full-time workers requiring days away, restricted duty, or job transfer (U.S. BLS Survey of Occupational Injuries and Illnesses, 2023-2024).
3. Veterinary Assistant
Injury and illness rate of 521 cases per 10,000 full-time workers requiring days away, restricted duty, or job transfer (U.S. BLS Survey of Occupational Injuries and Illnesses, 2023-2024).
4. EMT
Injury and illness rate of 440 cases per 10,000 full-time workers requiring days away, restricted duty, or job transfer (U.S. BLS Survey of Occupational Injuries and Illnesses, 2023-2024).
5. Insulation Worker
Injury and illness rate of 437 cases per 10,000 full-time workers requiring days away, restricted duty, or job transfer (U.S. BLS Survey of Occupational Injuries and Illnesses, 2023-2024).
6. Paramedic
Injury and illness rate of 414 cases per 10,000 full-time workers requiring days away, restricted duty, or job transfer (U.S. BLS Survey of Occupational Injuries and Illnesses, 2023-2024).
7. Water Damage Restoration Technician
Injury and illness rate of 409 cases per 10,000 full-time workers requiring days away, restricted duty, or job transfer (U.S. BLS Survey of Occupational Injuries and Illnesses, 2023-2024).
8. Appliance Repair Technician
Injury and illness rate of 369 cases per 10,000 full-time workers requiring days away, restricted duty, or job transfer (U.S. BLS Survey of Occupational Injuries and Illnesses, 2023-2024).
9. Veterinary Technician
Injury and illness rate of 367 cases per 10,000 full-time workers requiring days away, restricted duty, or job transfer (U.S. BLS Survey of Occupational Injuries and Illnesses, 2023-2024).
10. Maintenance Technician
Injury and illness rate of 342 cases per 10,000 full-time workers requiring days away, restricted duty, or job transfer (U.S. BLS Survey of Occupational Injuries and Illnesses, 2023-2024).
11. HVAC Technician
Injury and illness rate of 330 cases per 10,000 full-time workers requiring days away, restricted duty, or job transfer (U.S. BLS Survey of Occupational Injuries and Illnesses, 2023-2024).
12. Truck Driver (CDL)
Injury and illness rate of 328 cases per 10,000 full-time workers requiring days away, restricted duty, or job transfer (U.S. BLS Survey of Occupational Injuries and Illnesses, 2023-2024).
Sources
- U.S. Bureau of Labor Statistics, Survey of Occupational Injuries and Illnesses, 2023-2024.
About this guide: Researched and written by the TradeCareerPath Editorial Team. Our editorial team researches and sources every trade school and career guide using federal labor and education data, including BLS OEWS and Employment Projections, DOL apprenticeship records, IPEDS, College Scorecard, and state licensing boards. We follow the editorial standards documented at /editorial-policy/.